Debugging
Setup and Run Debugger for OSH in IntelliJ
These are instructions on how to run the debugger for an OSH Node in IntelliJ
- Allows you to build and run an OSH node without having to go through the process of full build, unzip, launch and configure.
- The OSH Node will build and run in the IDE with a
config.jsonthat can be saved between builds. - Allows for breakpoints to be utilized in driver and core code for insight into issues with drivers and other modules.
SensorHub Test Module
- Open your project directory, and check if your project contains the
sensorhub-testmodule under/osh-node-dev-template/tools/sensorhub-test.
Edit the build.gradle
- In the
sensorhub-testmodule, edit thebuild.gradleto include the drivers/processes/modules you want in the debug node.
Add debug task
We can either add the debug task manually with configuration shown below.
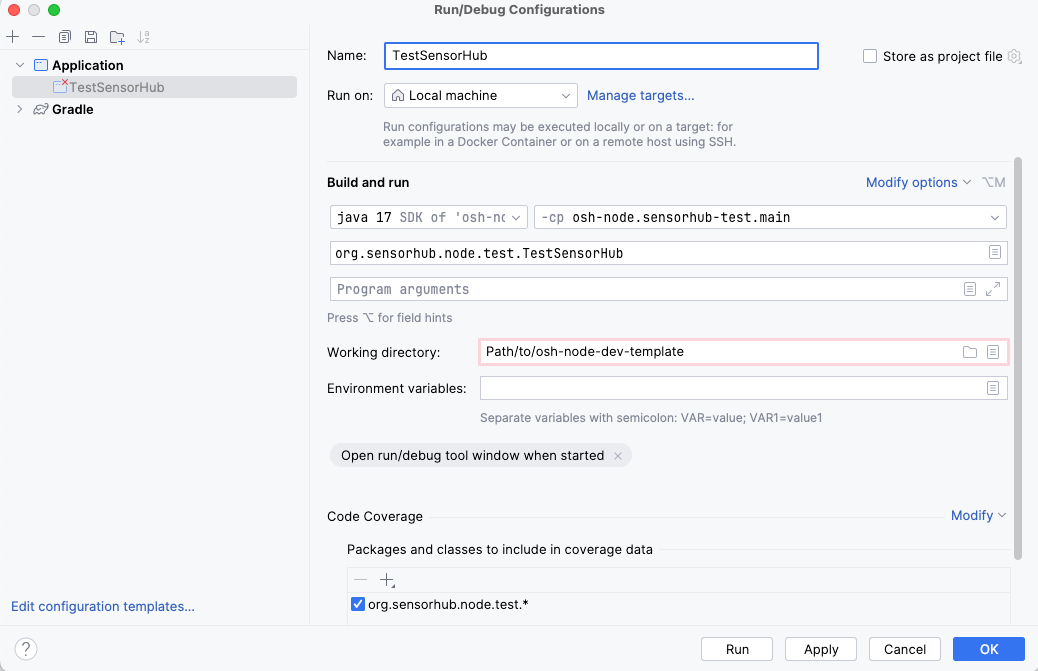
Or you can follow these steps in your IDE:
- Navigate to the
TestSensorHubclass in thesensorhub-testdirectory. Within that class, there should be several green arrows. These indicate runnable classes/methods. - Right-click on the
mainmethod insideTestSensorHuband selectRun 'TestSensorHub.main()'.
After following these steps, a new debug task configuration should be updated in your IDE.
Set Breakpoints
- Open the source of any driver or module that you included in the
sensorhub-test'sbuild.gradleof which you want to inspect the execution. - Click on any line number where you want to pause the execution and add a breakpoint (a red dot should appear).
Modify and Rerun
- Any changes made to the driver code can be rebuilt within IntelliJ without the need to go through a full build, unzip, and launch process.
- After any modifications, restart the debug session to apply changes and continue testing.
Checking Endpoint
- The
sensorhub-testdefault port is 8282. To navigate to theAdmin Panelyou can open any supported browser, and go tohttp://localhost:8282/sensorhub/adminand follow the steps to configure a module