Helpful Tips
Stack Traces
Stack traces are important for understanding what error occurred, and where it occurred.
Fatal errors will display stack traces in OpenSensorHub's Admin UI, and always in the terminal/logs.
Example error:
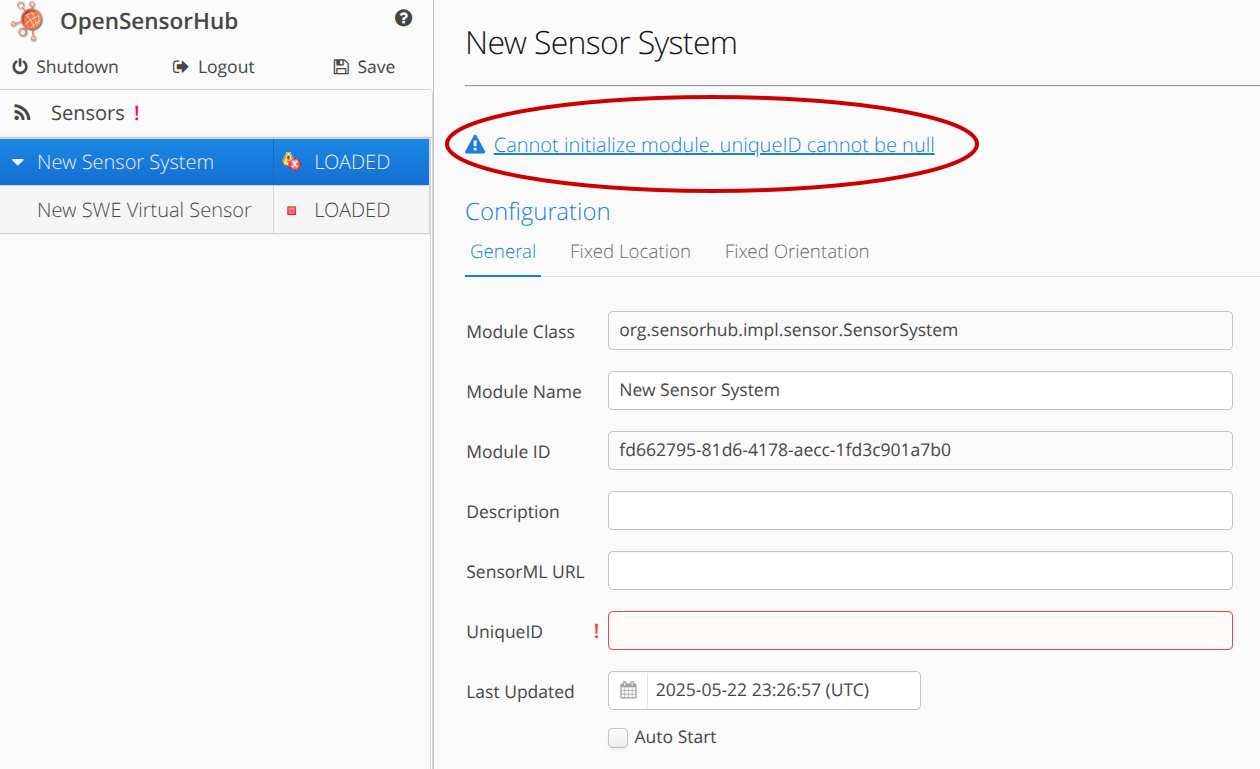
Stack trace from error (in Admin UI):
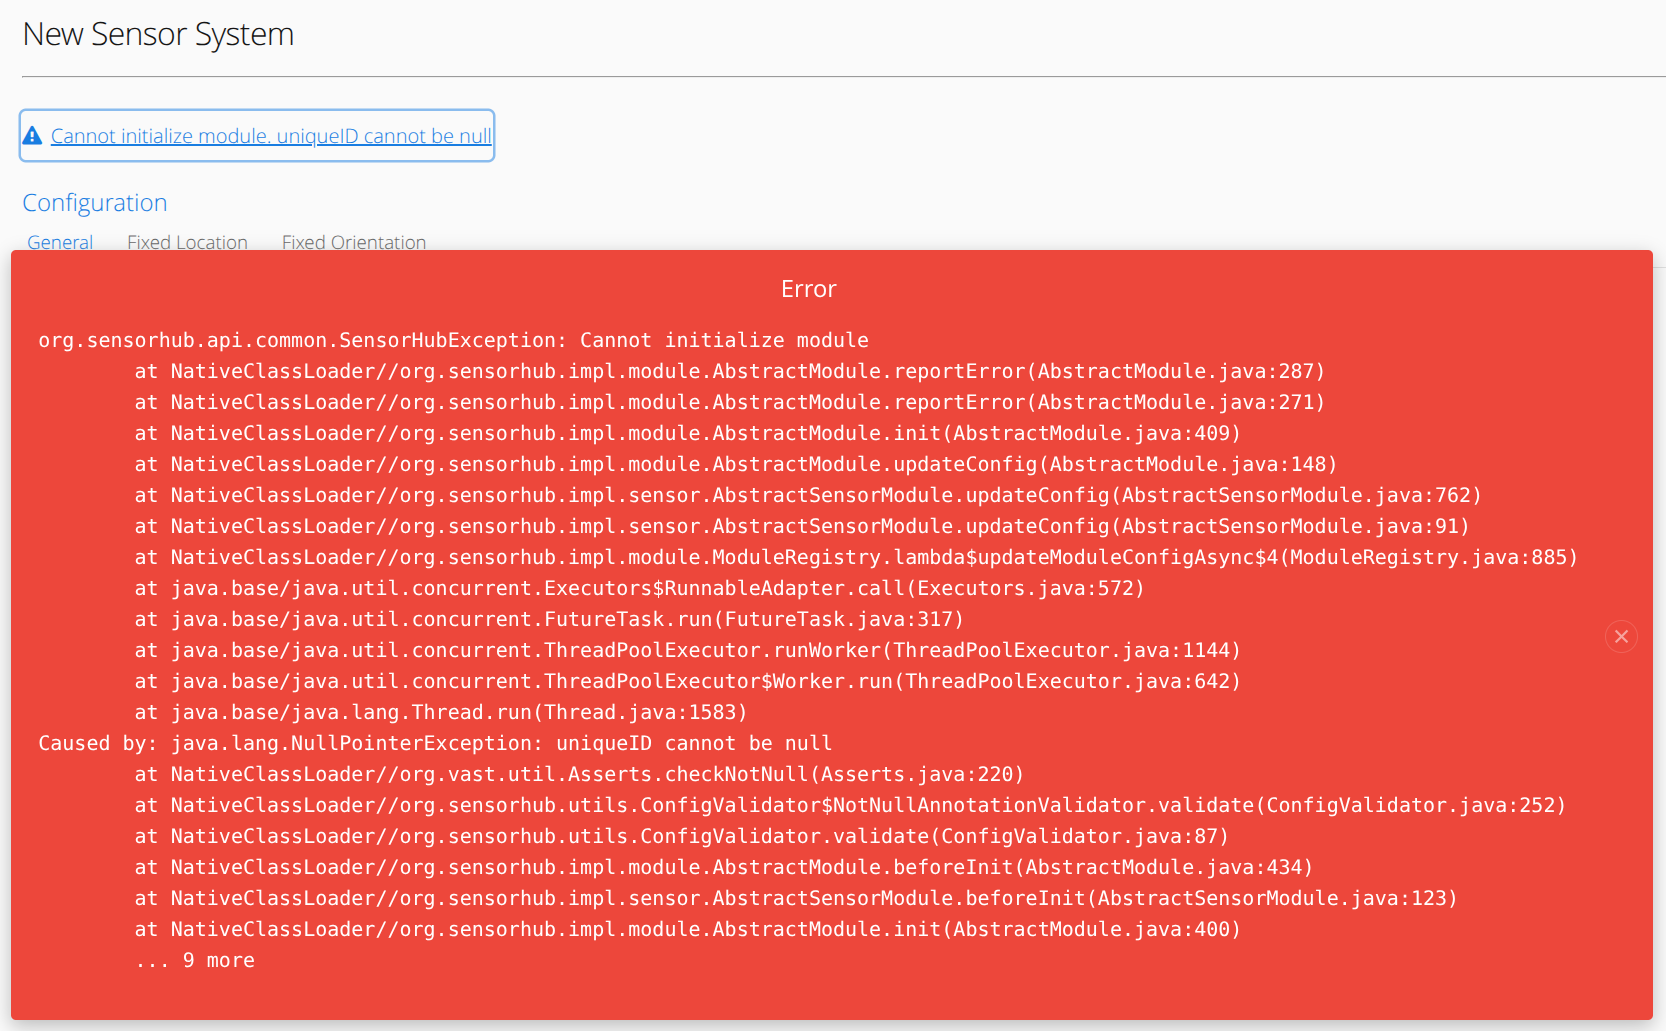
As you can see, usually the Exception thrown will contain a helpful message for debugging your application.
Debugging
If this message is not helpful, you may also see that the stack trace prints where the error occurred. If we navigate to one of the higher-level files/methods before the exception is thrown, we can set a breakpoint to see what happens right before the error.
Please see the OSH Debugging Guide to set up and use a debugger.
For this example, we saw that AbstractModule.beforeInit() is called a few levels before the NullPointerException is thrown.
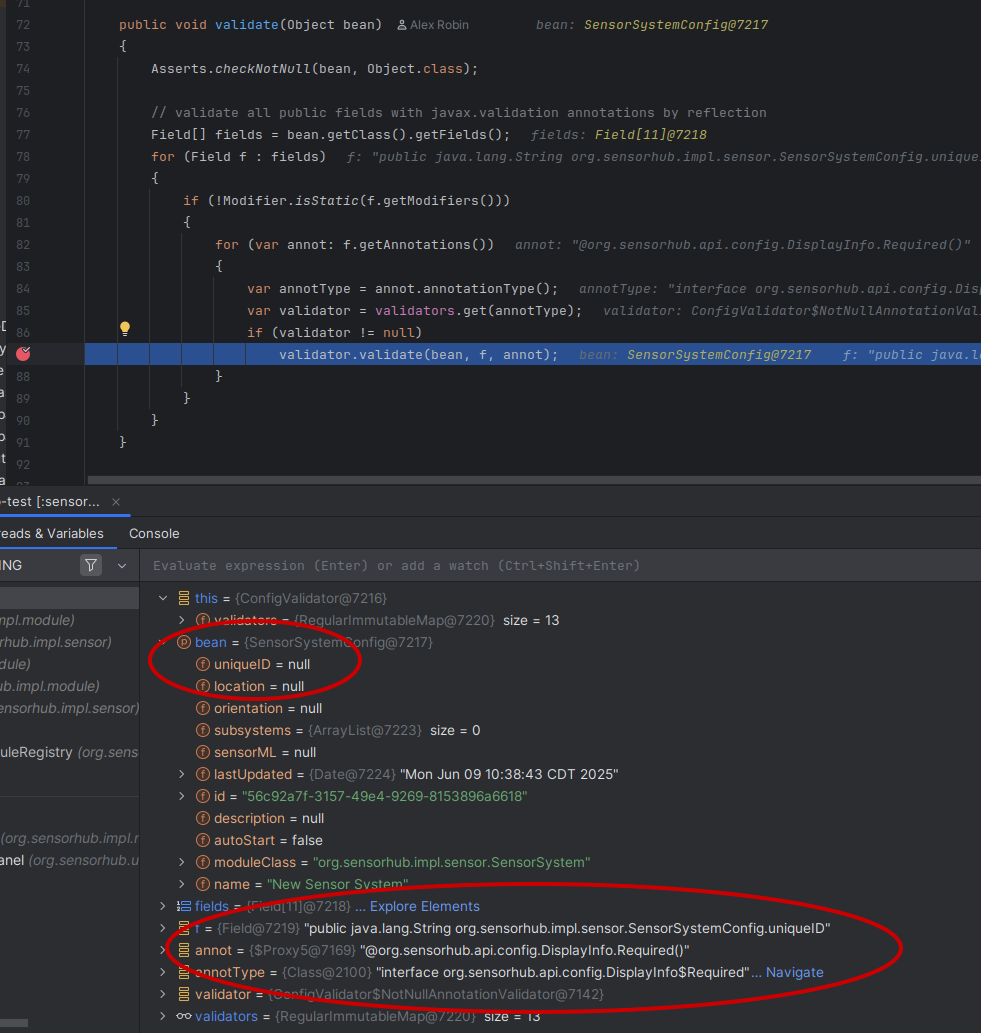
We can step through this method and find where the module configuration is validated.
Below you may see that the configuration field uniqueID is being validated.
This field has the annotation DisplayInfo.Required, so it must not be blank/null.
Therefore, we can assume the error is happening because the uniqueID field is null.
This is the most efficient way to resolve an unknown error.